Analysis
Overview
Based on subtype defined by Dr. Michael Snyder, we have developed a set of programs and work process to identify what is your diabetic type 2 subtype and then offer what type of food you should eat.
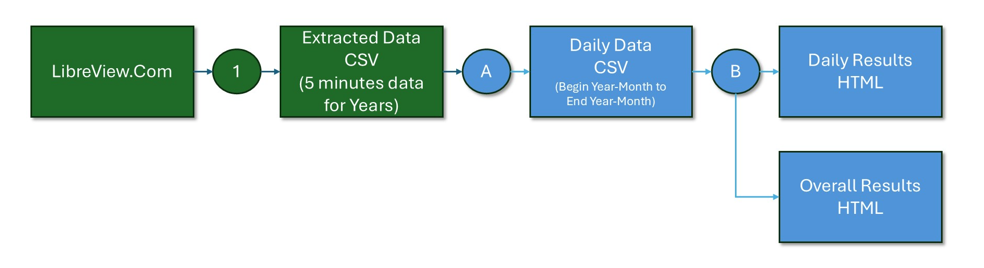
The figure below shows the overall work process
- Program A: Extract Data from LibreView
- Program B1: Convert the extracted LibreView data to Daily CSV files
- Program B2: Convert the extracted LibreView data to Yearly Report files
- Program C1: Convert the Daily CSV files (from B1) to Subtype Report
- Program D1: Generate AGP Reports using Daily CSV files (B1)
- Program E1: Generates a comprehensive report (B1,B2,C1,D1) as html and PDF
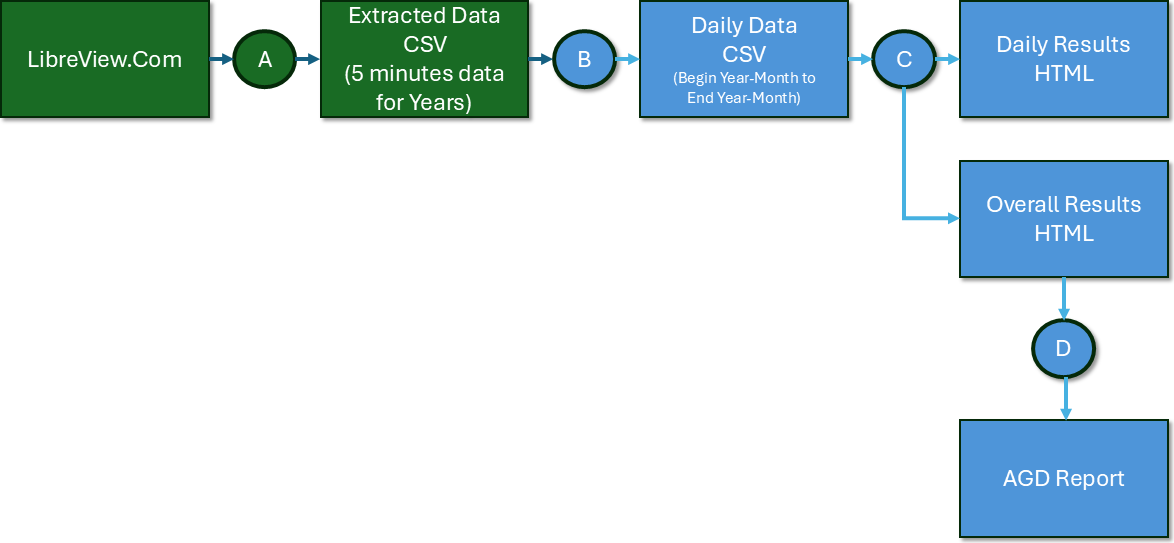
Figure 1: Overall work-process
Program A: Extract Data from LibraView
The user per our instruction will download the LibreView data in CSV format and upload it into our server
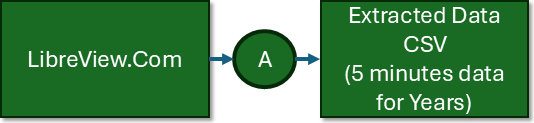
Figure 2: Part A of the work-process - User Extract Data
The yearly data is shown below needs to be organized for further analysis
Program B: Convert the LibreView data to Daily CSV files
Our program will convert the user CSV into daily data format to be analyzed by the next program.
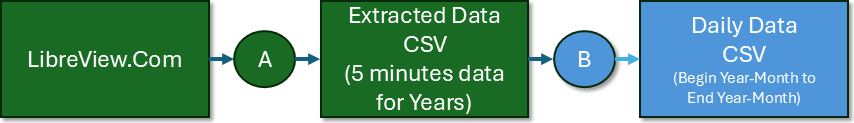
Figure 3: Part B of the work-process - Convert the data to daily data
Program C: Generate Subtype Reports
The program C functionality is divided as:
- Use the daily average data scanned each 5 minutes
- Predict zone that there is a peak or a meal is consumed
- Identify the subtype based on the zone behavior
Based on your data, program will generate the following chart
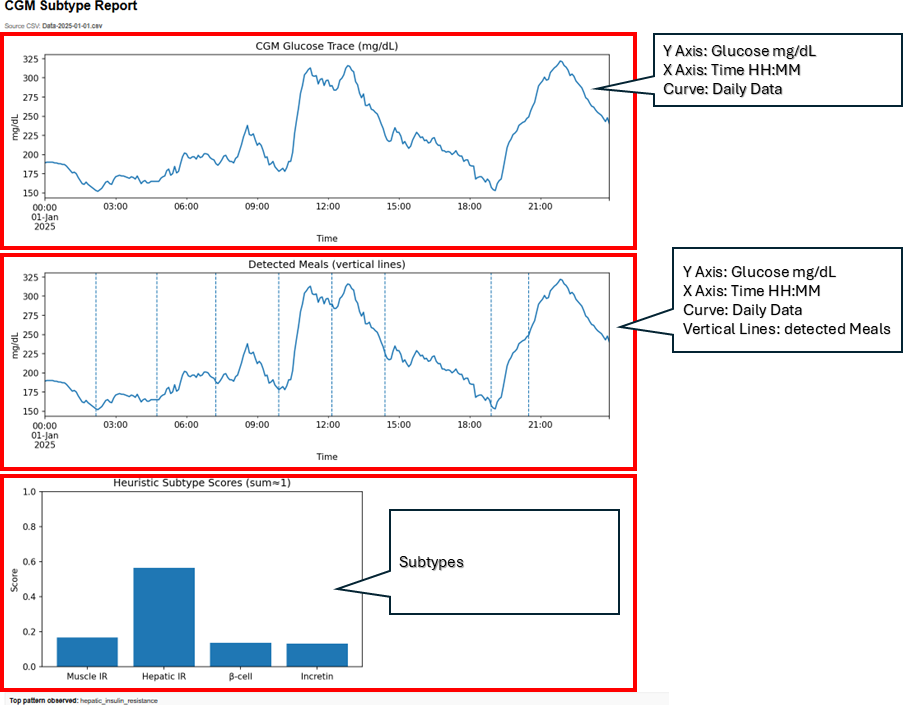
Figure 3: Program C Generate Subtypes for each day
- The top figure represents the CGM data for the 24 hours
- The middle figure represents same data as figure 1 but the program detect zones that you had meals
- The bottom figure uses the AI technology to assign Diabetes-Type 2 Subtypes based on zone based CGMProgram C - Overview of data
In the following figure the subtypes for your data is presented.
The histogram with the normal distribution superimposed is presented as well.
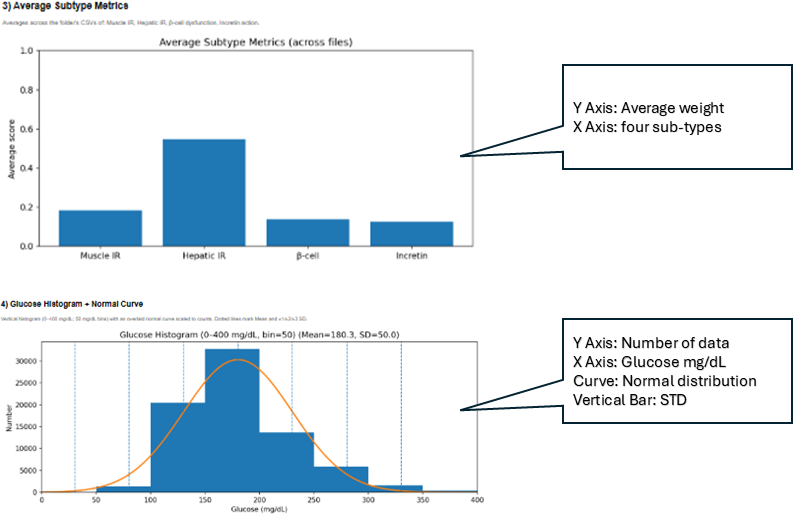
Figure 4: Program C Generate Subtypes and histogram
Program C - Overall Results
The original data is presented in the top figure
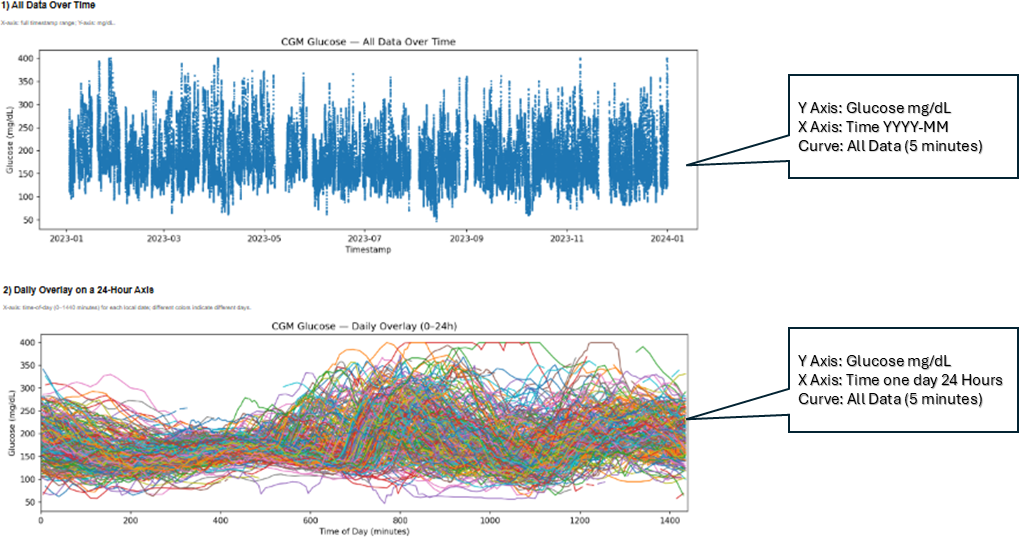
Figure 5: Program C Summarize the data
The bottom figure represent every plot of every day of the selected data
Program C - Subtype to Food
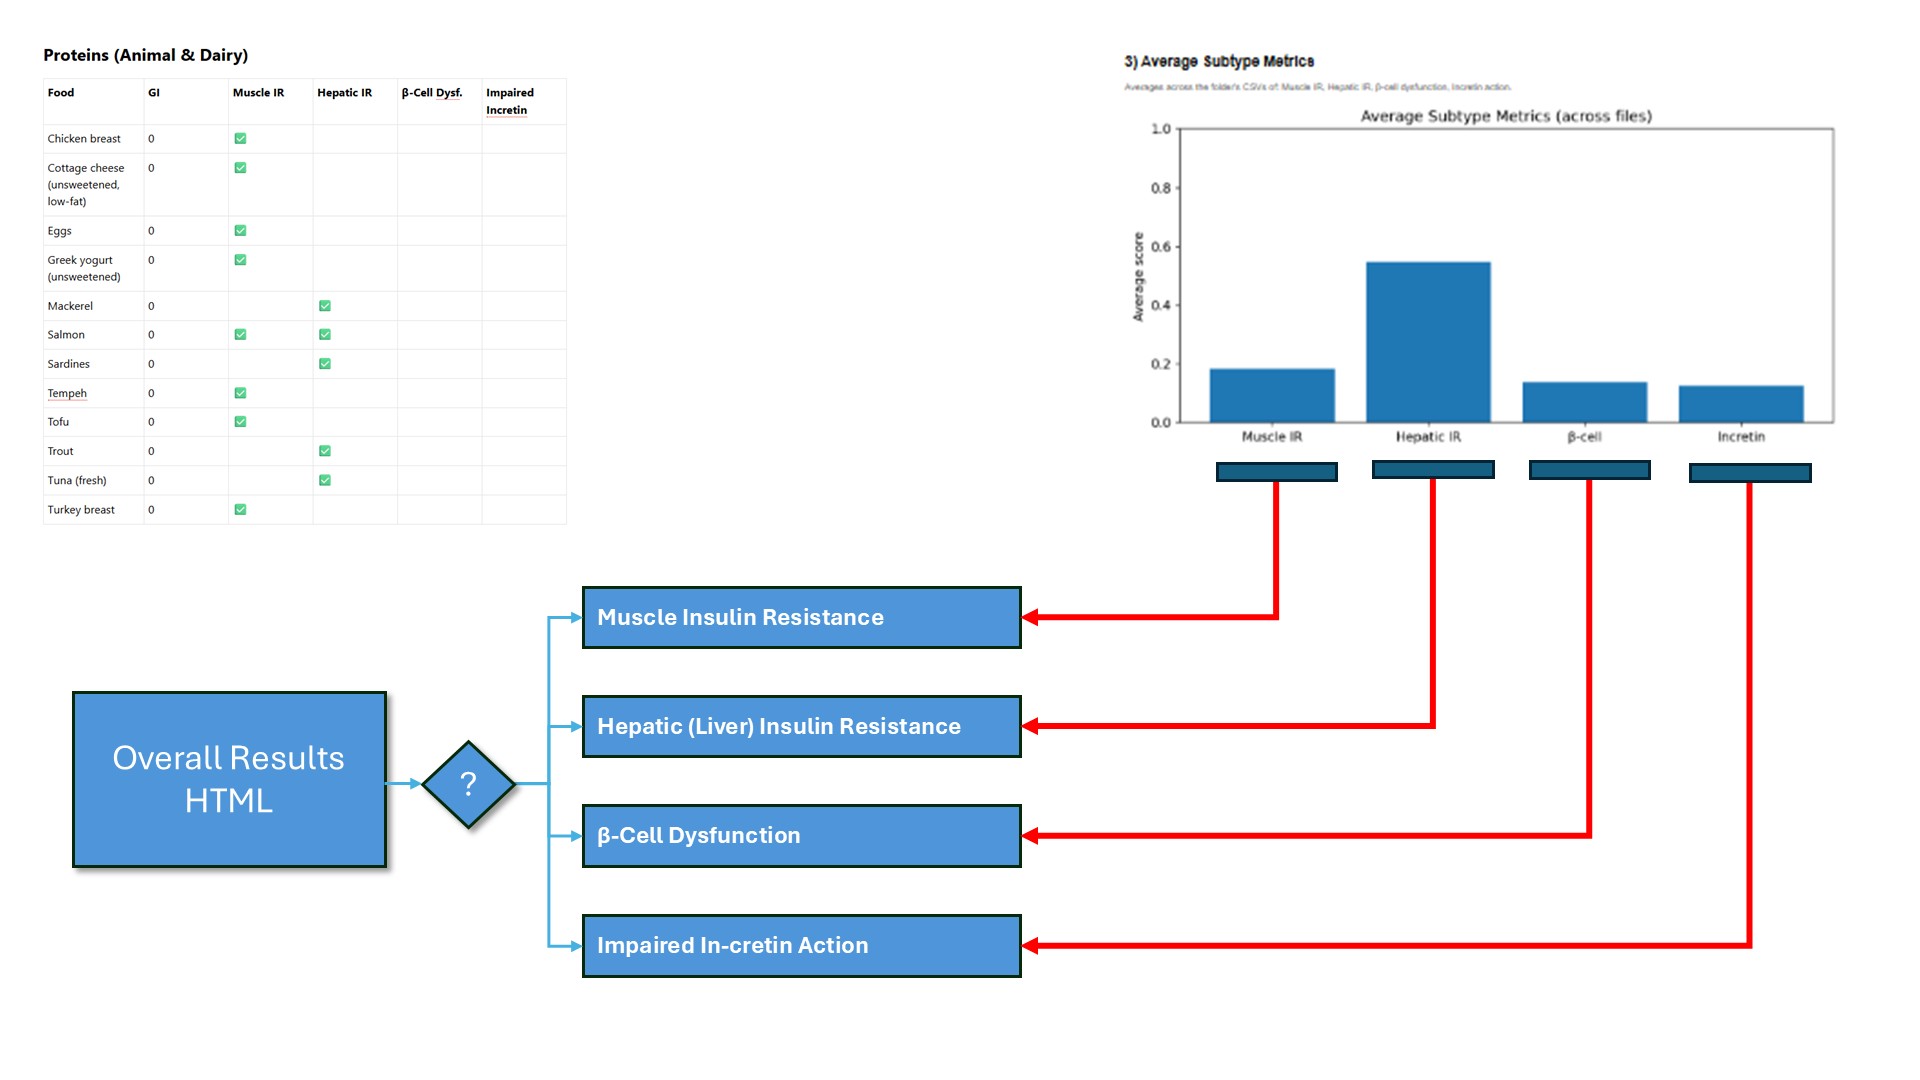
Figure 6: Program C Generate Overall subtypes
Based on your Diabetic Type 2 Subtype (DT2ST) the following provide the best meal to mange your diabetic.
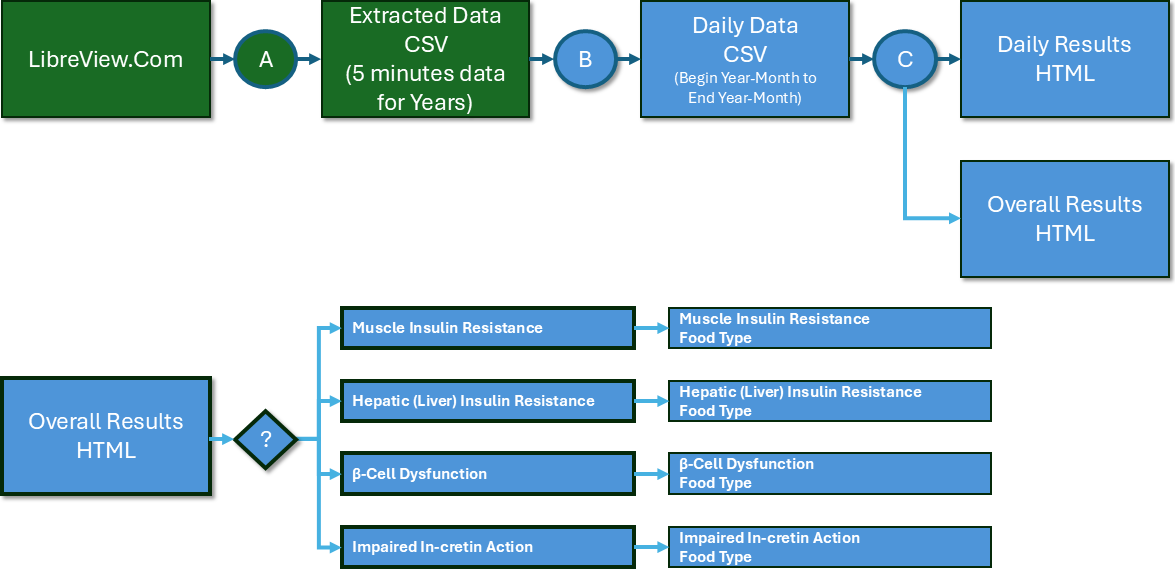
Figure 7: Program C Generate Overall subtypes
Program D: Generate AGP reports
The following work process converts LibreView data to daily csv files.
The program analyze each daily data (per folder) and create the following results
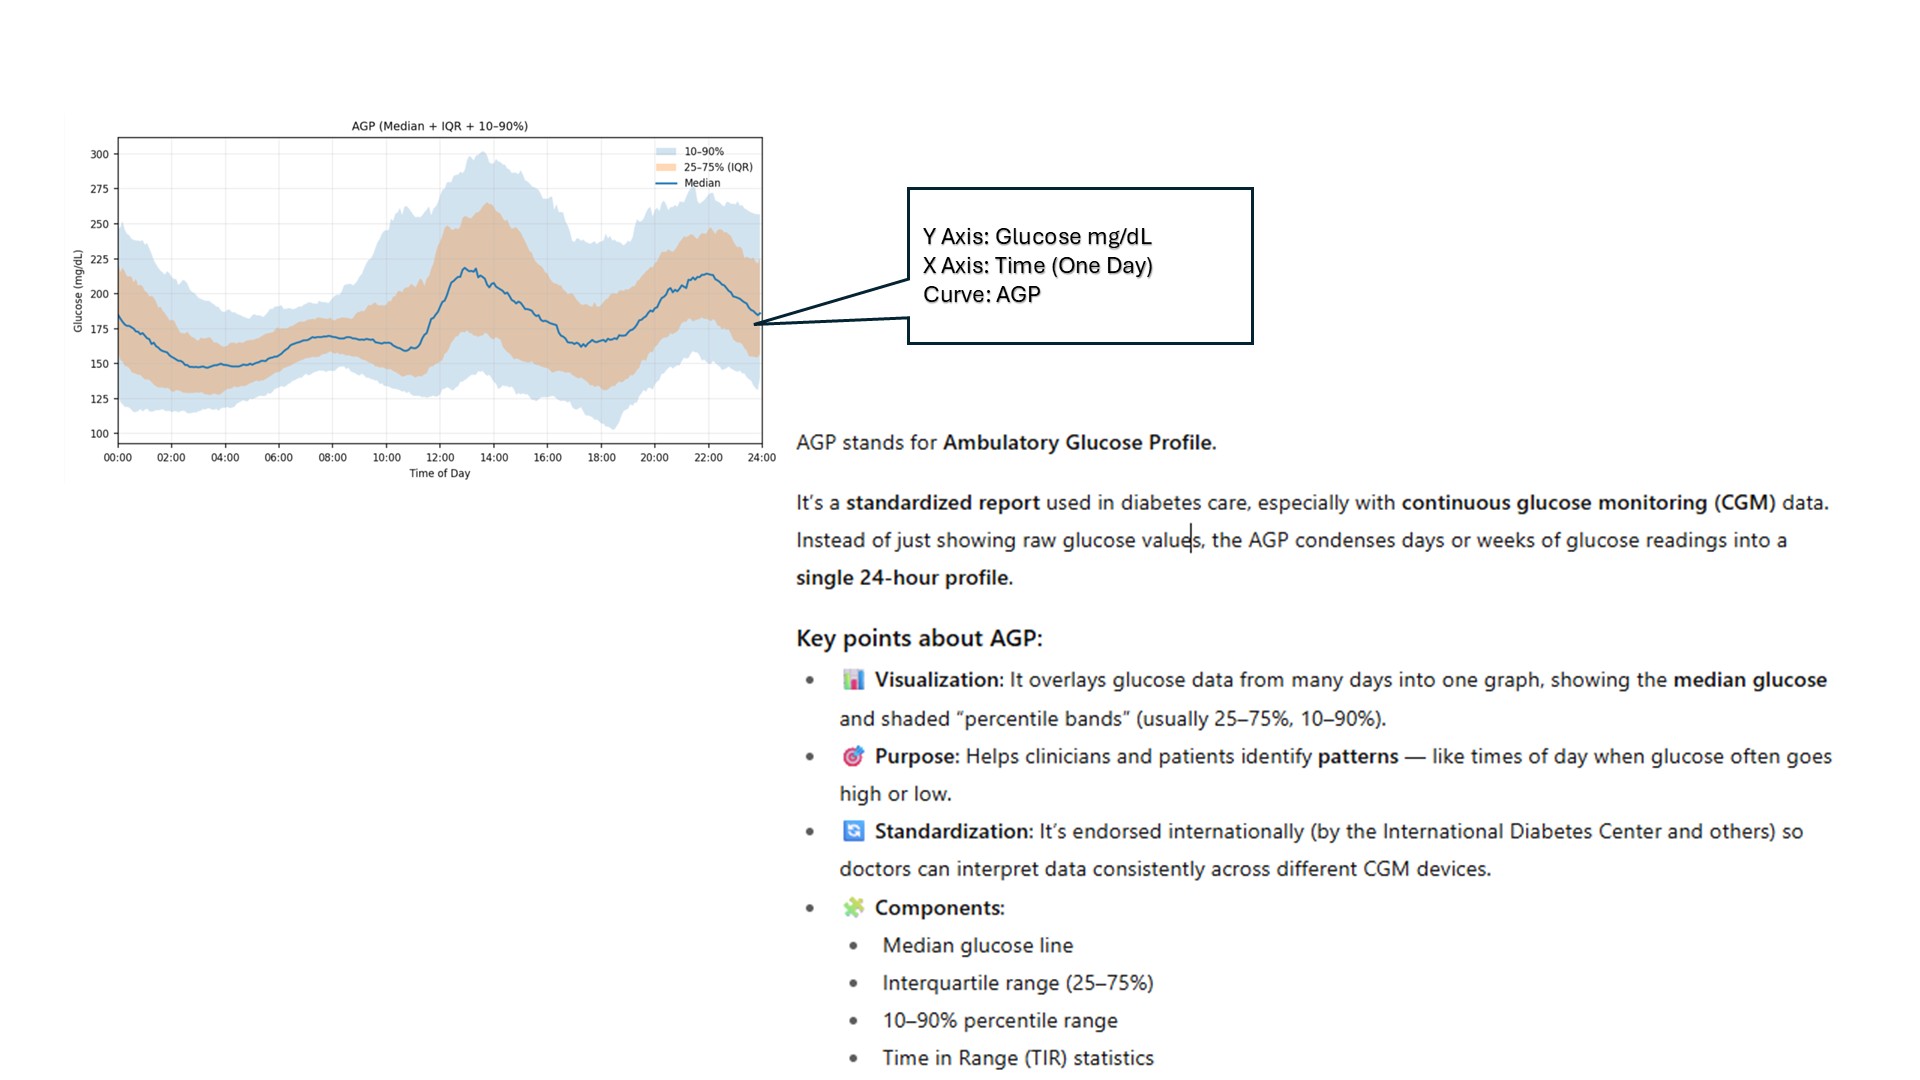
Figure 8: Program D generate AGP
What is an AGP?
The Ambulatory Glucose Profile (AGP) condenses many days of continuous glucose monitoring (CGM) into a single 24-hour “modal day.”
It overlays the median (50th percentile) glucose and percentile bands—typically 25–75% (dark band) and 5–95% (light band)—so you can spot time-of-day patterns (overnight lows, post-meal spikes, dawn phenomenon) at a glance.